ARGs_OAP Results’ Dashboard
The Result Dashboard provides an interactive visual summary of the results obtained from ARGs-OAP. Users can easily explore and understand the output data in a comprehensive format.
Input
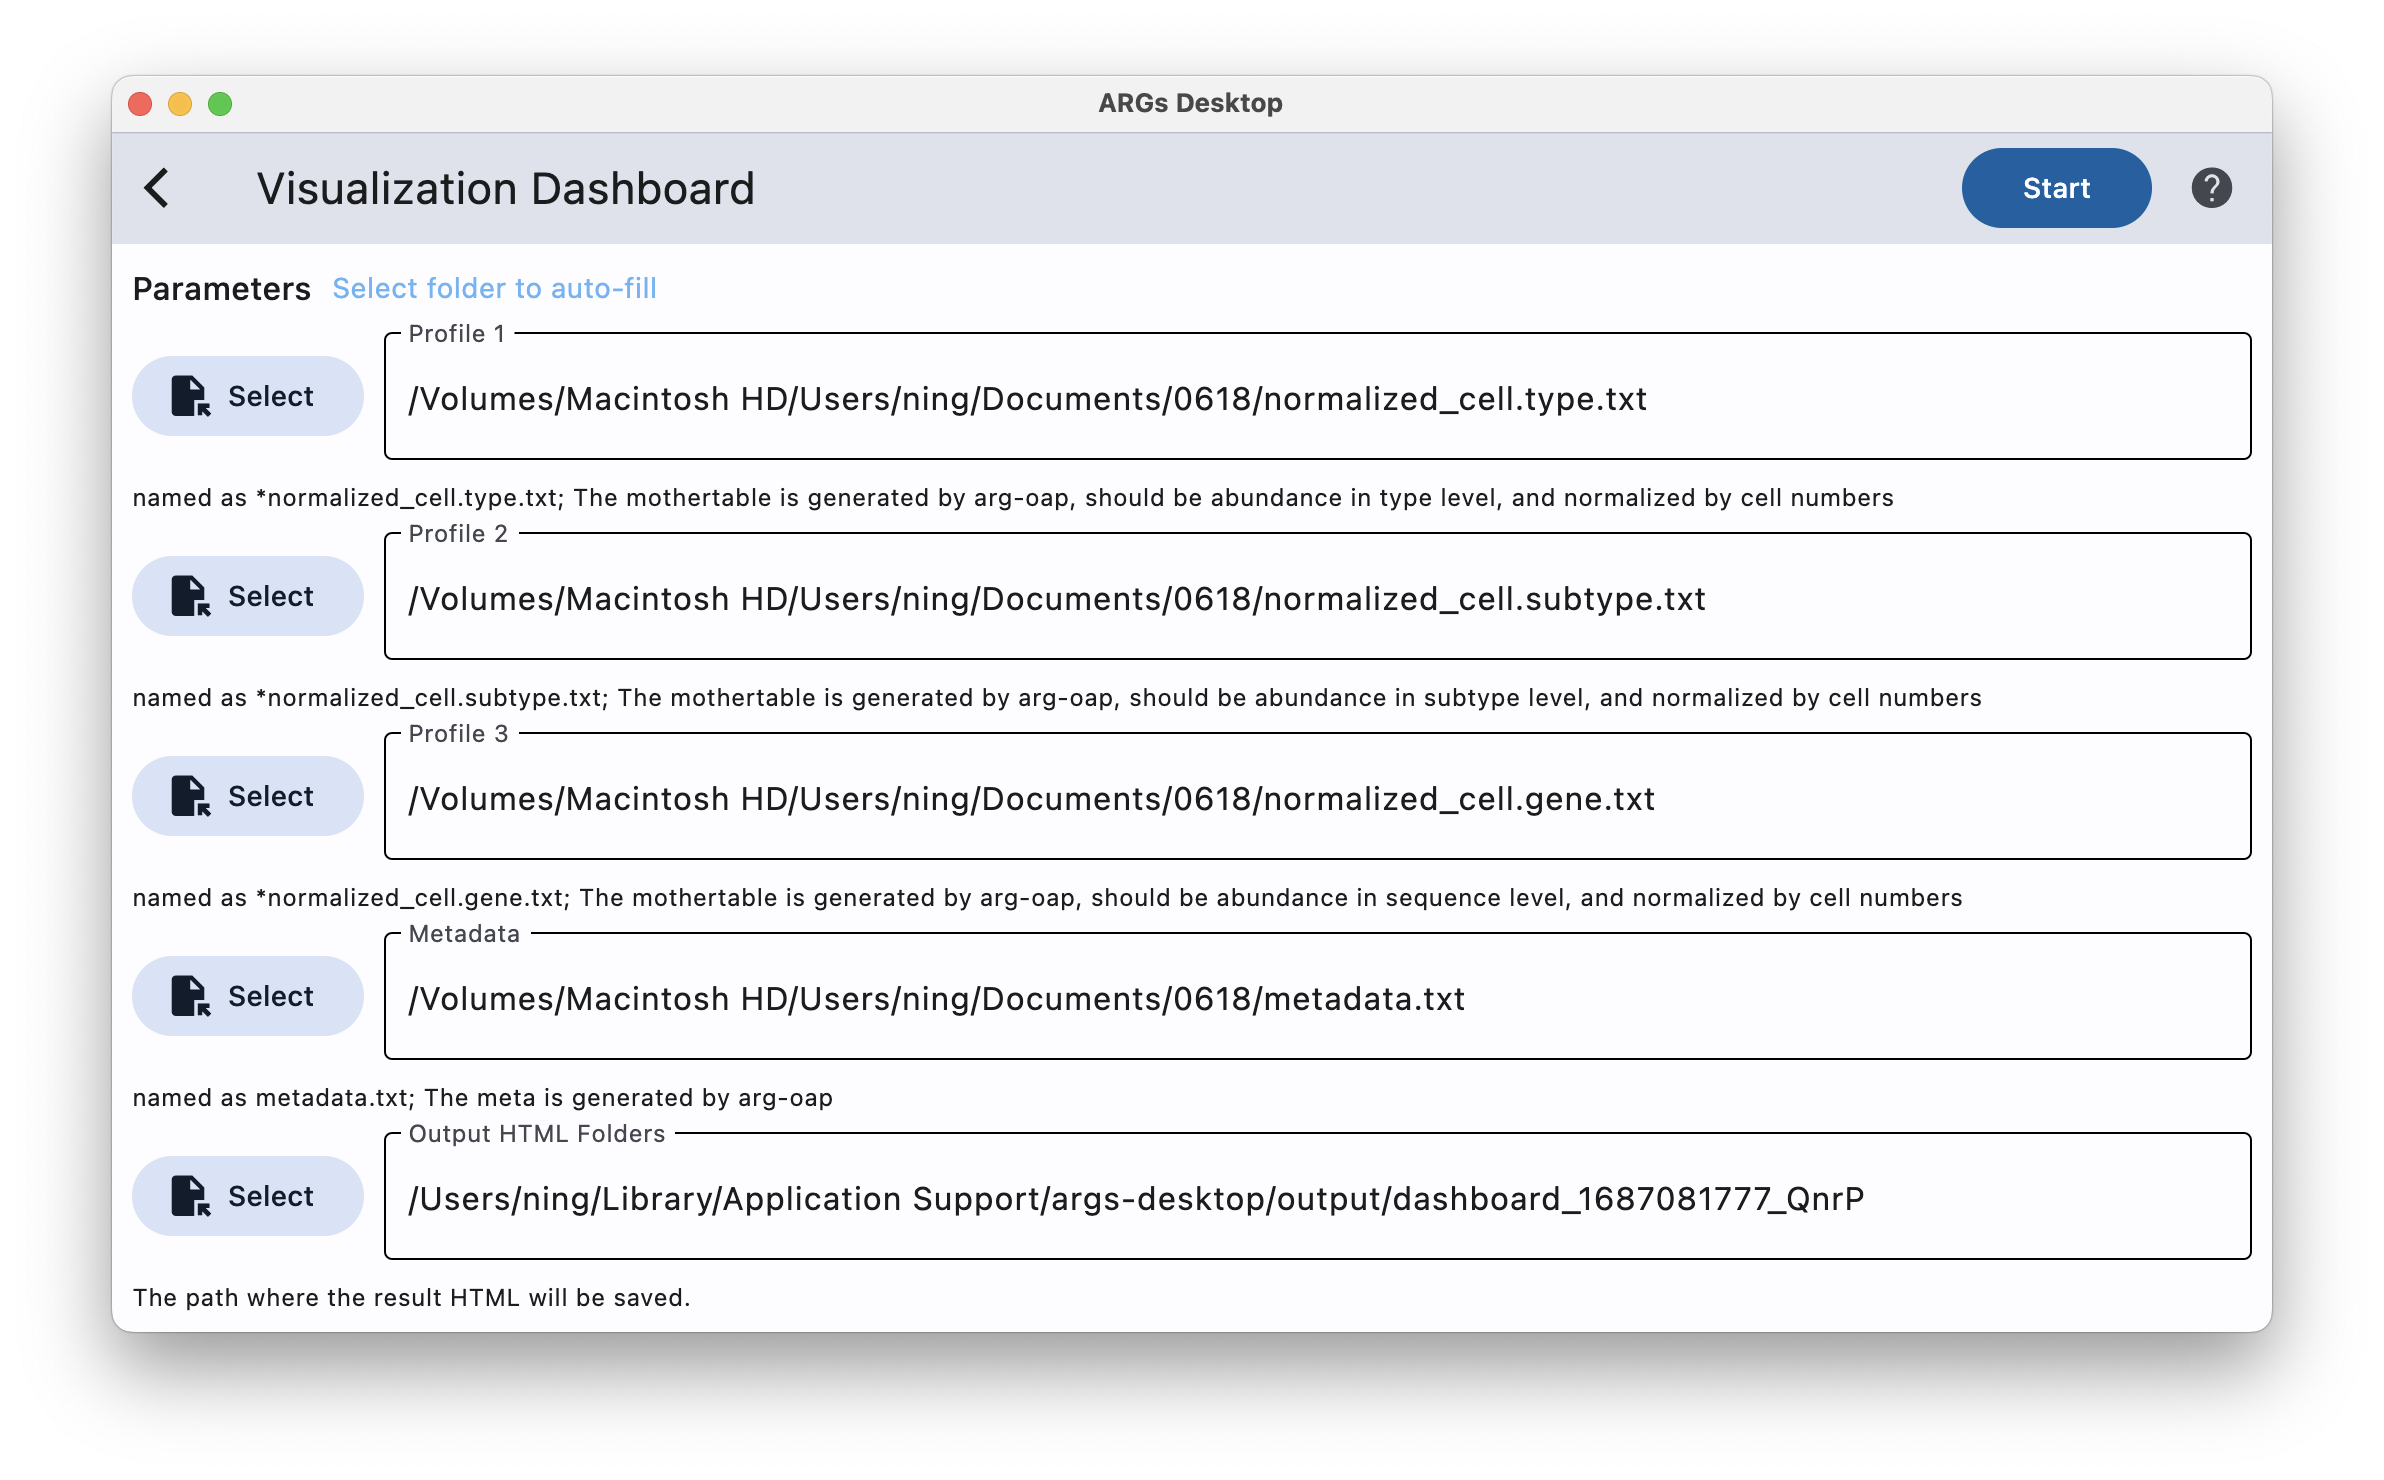
You can directly use autofill function to visualize ARGs-OAP’s results.
You can get the example from Galaxy -> Visualization - dashboard after ARGs-OAP -> For ARGsOAP 3.2 (link)
Output
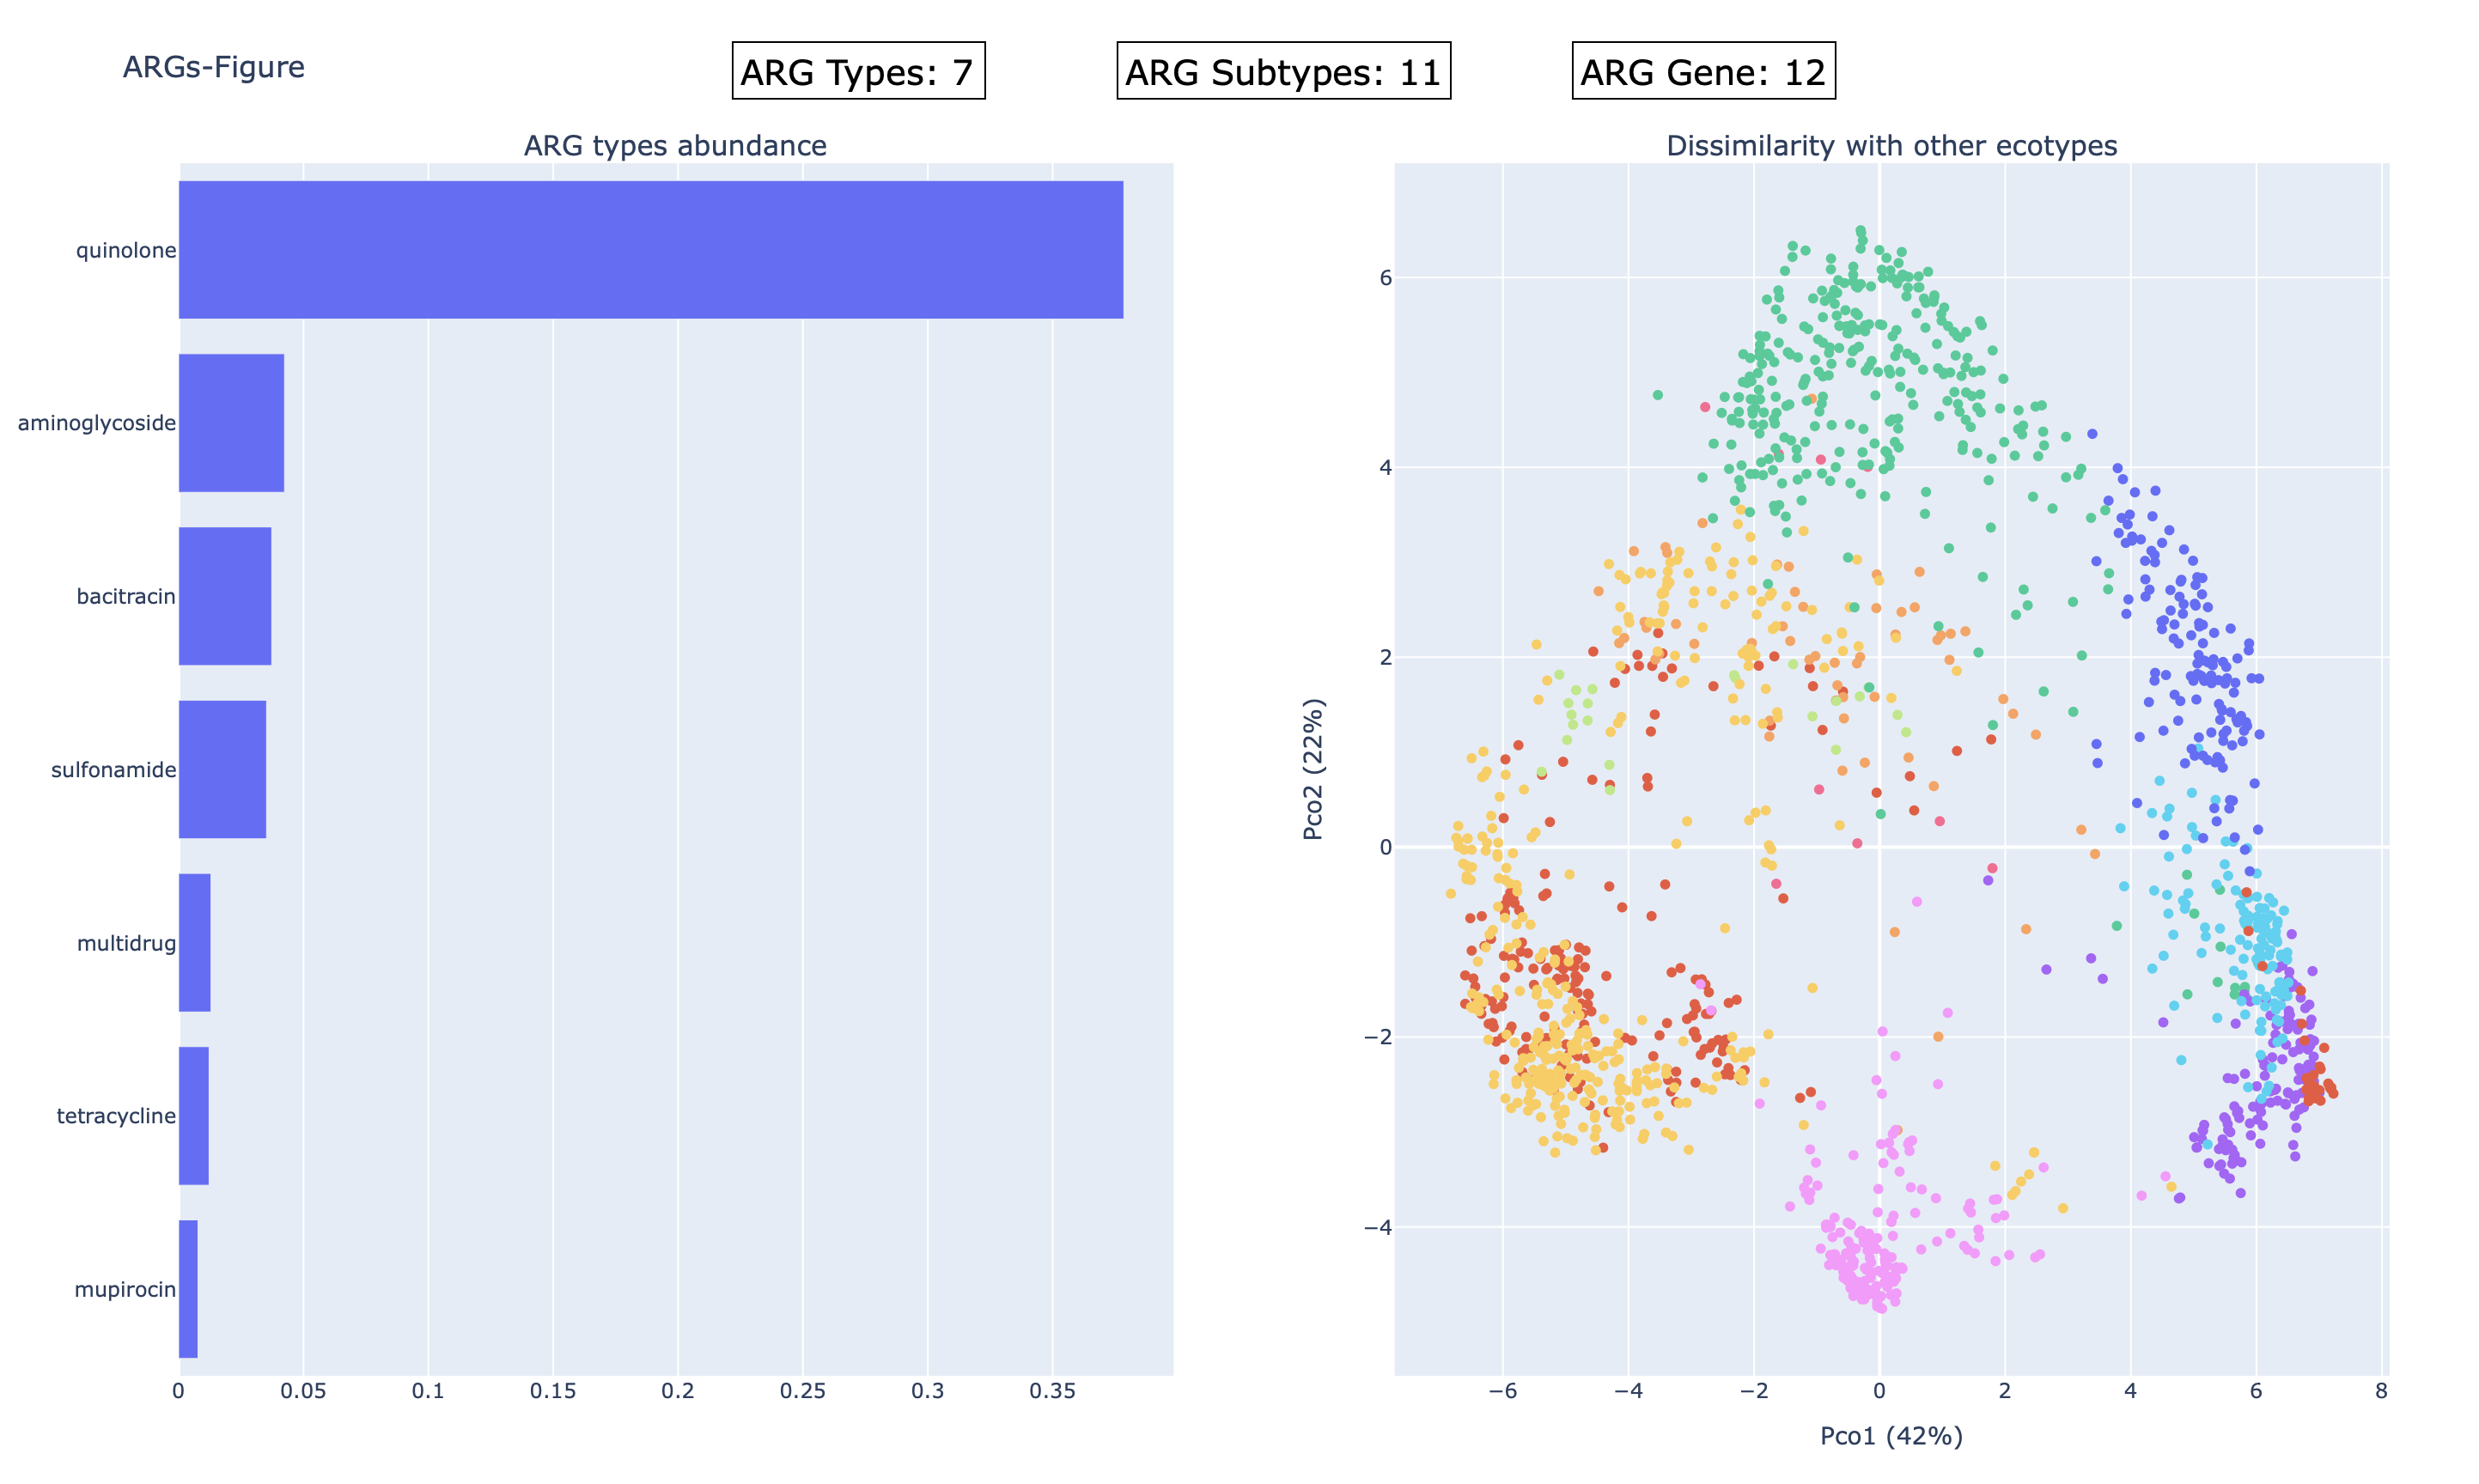
HTML files.
Example outputs: STAS_figure.html, SWHAS104_figure.html